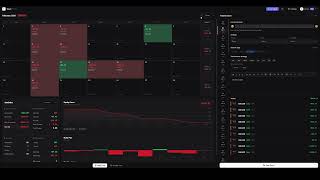
Statistics
Profit / Loss
Gross profit
$0.00
Gross loss
$0.00
Max Drawdown
—
Net P&L
$0.00
Performance
Win rate
0%
Avg win
$0.00
Avg loss
$0.00
Risk : Reward
—
Profit factor
—
Activity
Total trades
0
Winning
0
Losing
0
Trading days
0
Distribution
↑ Long
0%
↓ Short
0%
Best day
—
Worst day
—
Win streak
0
Equity Curve
Cumulative P&L over time
Cumulative P&L
Break-even
Daily P&L
Last 60 trading days
Profit
Loss
Instruments
P&L by symbol
Hourly P&L Heatmap
Net P&L by entry hour
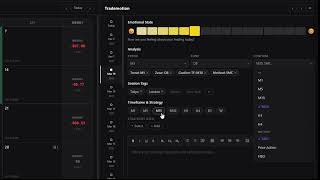
Trademotion
Emotional State
😞
😊
How are you feeling about your trading today?
Analysis
Trend
Select▾
M1
M5
M15
M30
H1
H4
D1
W
Zone
Select▾
Demand
FVG
iFVG
IDM
IND
Next Line
OB
POI
Supply
Confirm
Select▾
TF
1S
5S
15S
M1
M5
M15
M30
H1
H4
Method
ICT
SMC
Price Action
FIBO
Sweep Liquidity
Wyckoff
Session Tags
Timeframe & Strategy
Strategies used
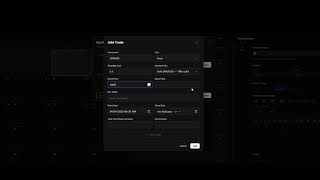
Trades